Table of Contents
Cox proportional hazard regression model
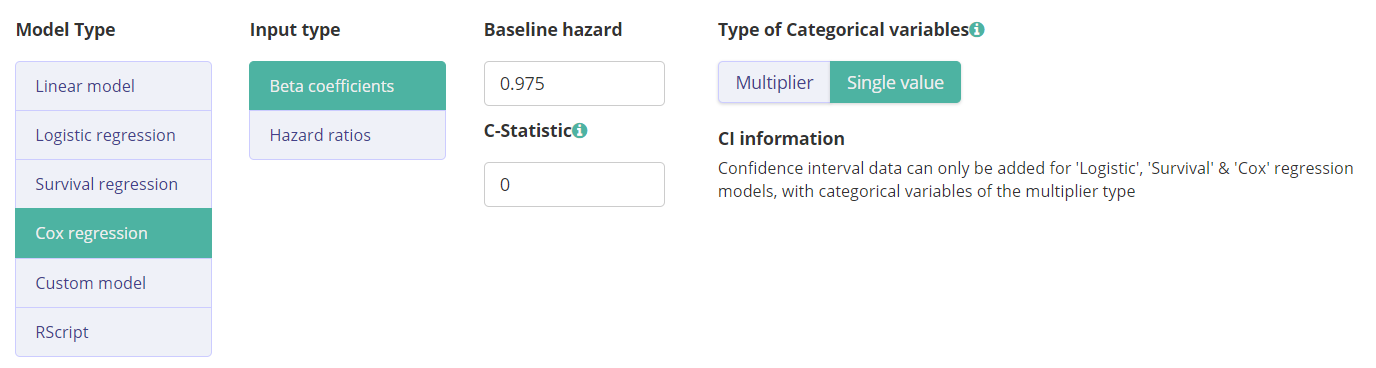
When creating a model, it is possible to select the cox regression model in the Model tab.
The standard cox regression formula looks like this: P(t) = h0EXP(∑Xβ)
Where h0 is the baseline hazard, the survival proportion when all covariates are equal to zero (Xβ = 0).
Xβ is the model linear predictor, estimated by the summation of all the β values multiplied by that variable. E.g. βvar1 ⋅ var1 + βvar2 ⋅ var2 + βvar3 ⋅ var3………. βvarN ⋅ varN
It is possible to select Beta coefficients or Hazard ratios in the model. Evidencio transforms the input values so the equation can be solved correctly and the output will be shown as a percentage.
Follow the link to learn more about Cox regression models.
Adding a cox regression model
In research papers describing the development of a model using cox regression analysis, the beta coefficients and baseline hazard are not always clearly described. However, there are several ways to derive the cox regression formula from the data that is shown. Mostly, hazard ratios are given, baseline hazards are often missing, but sometimes an example is given in the paper or in supplementary data.
Example: (This example is made up to simplify the explanation and does not represent realistic data.)
A model is presented to predict the risk of developing knee-pain with Age and Weight as predictors.
Given Beta coefficients are -0.045 for age and 0.06 for weight.
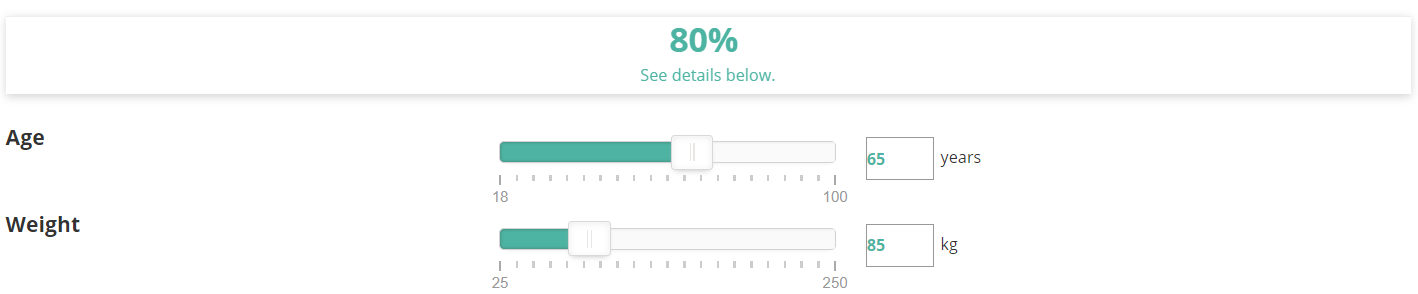
Also, the model shows an example: “Individuals at the age of 65 weighing 85 kg have an 80% risk of developing knee pain”.
Now we know the outcome of a calculation without knowing the baseline hazard. So we can derive the one unknown constant in the formula.
We know that P(t) = h0EXP(Xβ)
P(t) = 0.8
Xβ = 65 · -0.045 + 85 · 0.06 = 2.175
So if we know that 0.8 = h0EXP(2.175)
We can find that the baseline hazard is approximately 0.975. Note: These kind of derivations might not always be accurate so make sure to verify your input or validate the model.
Now we're able to add the model on Evidencio.
First add the model details in the model tab and add the baseline hazard. Then add the variables at the models/variables tab.
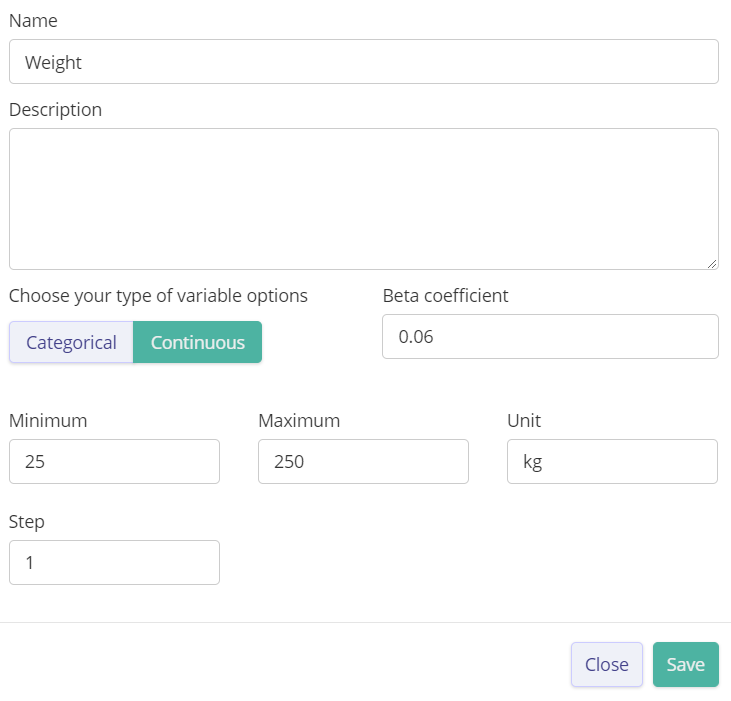
We add age as continuous variable ranging between ages of 18 and 100. Then we add weight as a continuous variable ranging between 25 and 250 kg. Now our model should work properly. If we click on save model and show model, our input looks like this. We can see that the 80% is predicted so it seems to work properly. Try out different inputs to see how the outcome will differ based on the input (e.g. risk increases as age increases.)
Note: Sometimes a model predicts a risk, but shows the outcome as free of event. In our example this could mean that the 80% predicted risk of developing pain can be interpreted that there is a 20% probability of remaining free of pain. In the model editor at the results tab, there is a possibility to show the complement of the calculation.
Practical example & Variable conversions
Not all published cox regression models follow the same formula as the standard formula on Evidencio. However, if all ingredients of the formula are present in the original article or supplementary materials, you will be able to add the model on Evidencio. To show how this works in practice, a real model will be added step-by-step.
The model shown in this example concerns the 10 year risk on cardiovascular disease10 year risk on cardiovascular disease in women. All the model coefficients can be found and are presented clearly in the table below:
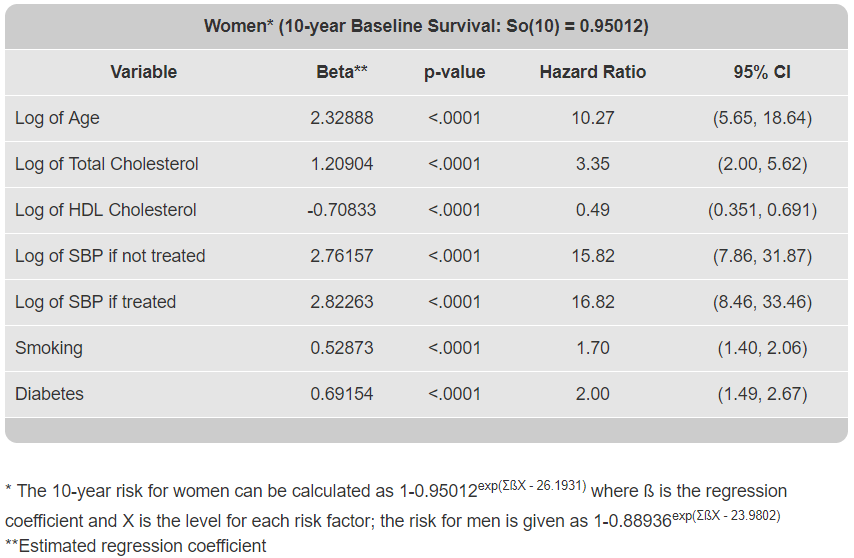
One of the first things to notice is that the formula presented at the bottom of the table is not te same as the standard formula available on Evidencio. First of all the model uses the complement of the calculated risk which is reflected by the “1-” in the formula. Next we can see the “exp(∑βX-26.1931)” in the formula, this means that the calculated sum of all beta coefficients in the model is penalized by 26.1931. This 26.1931 is in this case the sum of all beta coefficients multiplied by the average characteristics of the development cohort. And finally we can see that we have to use the log of the continuous variables in the model, and of course we want to use the age as input in the model and calculate the log ourselfs on the back end of Evidencio.
- Add a new model or edit an existing model on Evidencio and go to the fourth tab “Model”. (information on the other tabs can be found here)
- Select Cox regression, Beta coefficients, Single values, and enter the Baseline hazard (0.95012 in this case).
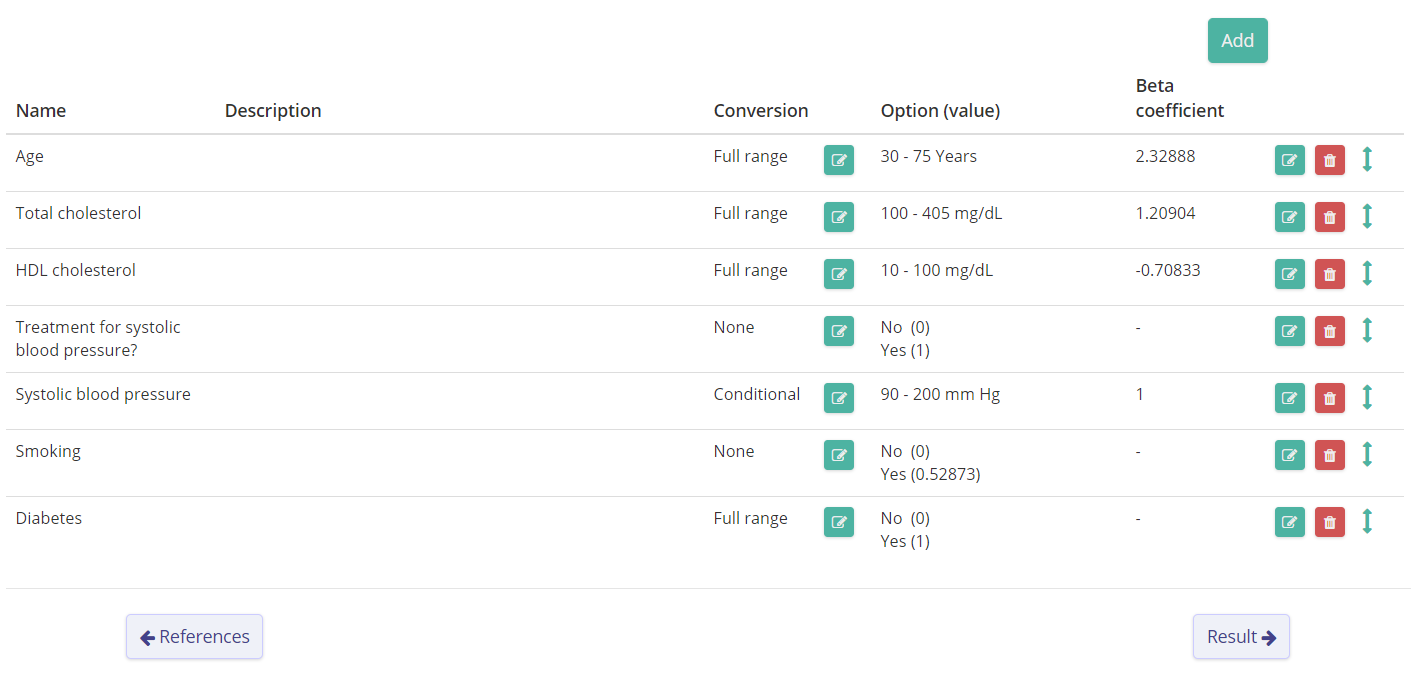
- Go to the sub-tab “variables” and enter the variables from the table. (make sure to seek which ranges the model includes).
- Click on this example to see how the variables are added on Evidencio. Below the column conversions we can already see that some variables either have full range or conditional conversions
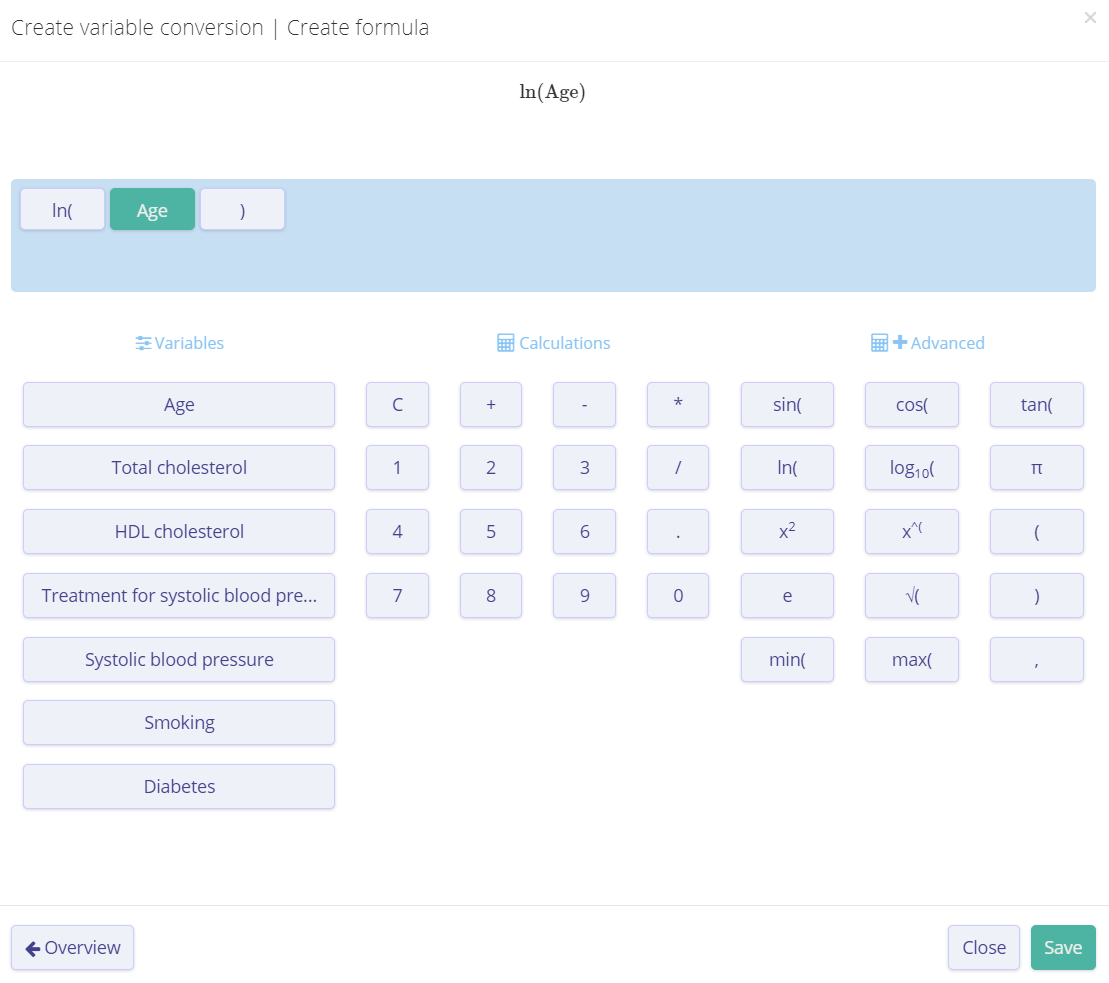
- Add conversions to the variables if necessary. In this case we want the log of all the continuous variables, so we want a single conversion. See this example on how to add a single conversion. We simply calculate the natural logartithm of the age. The outcome of the conversion is the varx in the βvarx ⋅ varx part of the formula, so make sure that this calculation adds up to your desired outcome. In case of age, we can see that the beta coefficient of 2.32888 was entered. Another possibility is to enter a beta coefficient of 1, and then use the complete “βvarx ⋅ varx” formula as your conversion. If you do this, the outcome of the conversion will be multiplied by 1.
- Next we want to see if any other conversions are necessary. The current model uses different beta coefficients for blood pressure based on the treatment of blood pressure. So we want to know if the patient did receive treatment (reflected in the fourth variable added on Evidencio). We can see that a beta value of 1 was added to the option “Yes” in this variable. This is not necessary to do, but was added for a check on the back end of Evidencio and we need to be sure that this 1 will not be used in the eventual calculation of the risk.
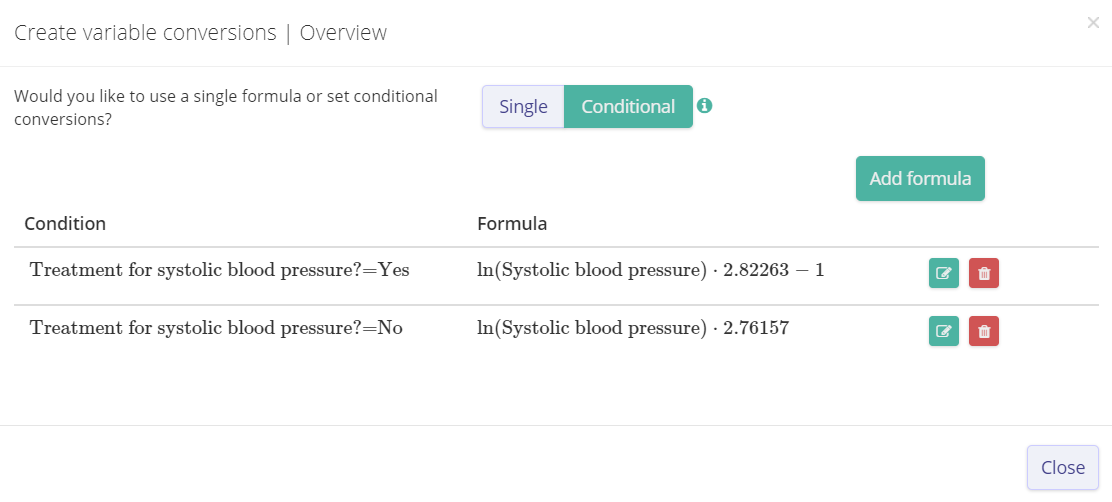
- Now we want to add the conversion of the blood pressure. See this example on how to perform the conditional conversion. We can see that if the entree of “blood pressure treatment” was “Yes” then we use a different beta, also we substract the 1 which was added in the first place as explained above. In this conversion we make the calculation of the beta times the log of blood pressure ourselfs and let Evidencio multiply it by 1 (reflected in the input beta coefficient of 1).
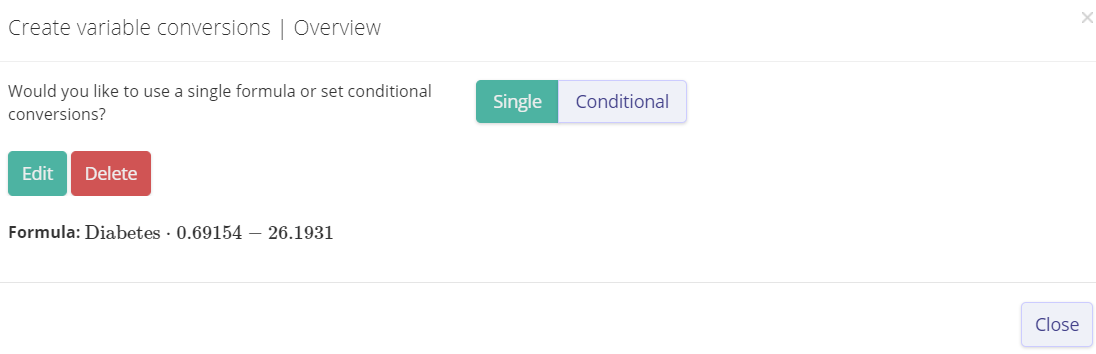
- Finally, we want to add the penalty of 26.1931 to the model. This can be done by making a conversion which substracts the penalty from the calculation. See this example on how to do this. We can see that despite the input of diabetes, it will always substract 26.1931.