Rscript model
R is an open source statistical programming software and can be used with the use ofRstudio. It is possible to copy Rscripts directly into Evidencio and calculate predictions. As long as the script returns a single outcome, the model will work.
To add an Rscript model, create a new model, or edit an existing model. Go to the fourth tab Model and click on Rscript at the model types. An extra sub-tab will show where it is possible to add the Rscript. More information on how to fill in the rest of the modeldetails can be found here.
Example: Partin tables
To give an example on how an Rscript can be implemented as an online calculator, the Partin Tables described by Tosoian et al. were used. A screenshot of this Table is shown below. The Partin tables predict the probability of Organ confined disease (OC), Extraprostatic Extension (ECE), Seminal vesicle invasion (SV), and Lymph node invasion (LN). Predictions were done based on the clinical tumour stage, prostate specific antigen and Gleason score.

Even though the Partin tables were based on a logistic regression. The beta coefficients and intercepts were not given in the published paper. Still, all the possible inputparameters and probabilities can be found inside the table. One of the first things to notice is that all the predictions in the table contain confidence intervals. Since the output must be a single number, the confidence intervals cannot be shown on Evidencio.
To automatically read the table, the table has been transformed into a table in R. The Partin table predicts 4 possible outcomes, so for one model, one prediction is selected as output. For this example, the probability of lymph node involvement is shown. The screenshot below shows the table in R where the values 50, 100 and 150 for clinical T stage were transformed from cT1c, cT2a, and cT2b/cT2c, respectively.
The column PSA contains the input PSA levels. The 10.1 represents all PSA values >10 and the 4.0 represents all PSA values ≤4. The values in the columns of the gleason scores contain the probabilities of lymph node involvement. So we can see that a patient with a clinical stage T1c, Gleason sumscore 3+4=7, and PSA of 15 has a probability of 5% for lymph node involvement.

Now we need to make a script in R that reads the table. This was done by using y, x, and z coördinates that correspond with the cT stage, PSA, and gleason score. The cT stage was already transformed to 50, 100, and 150. The Gleason score will be transformed to, 1000, 2000, 3000, and 4000.
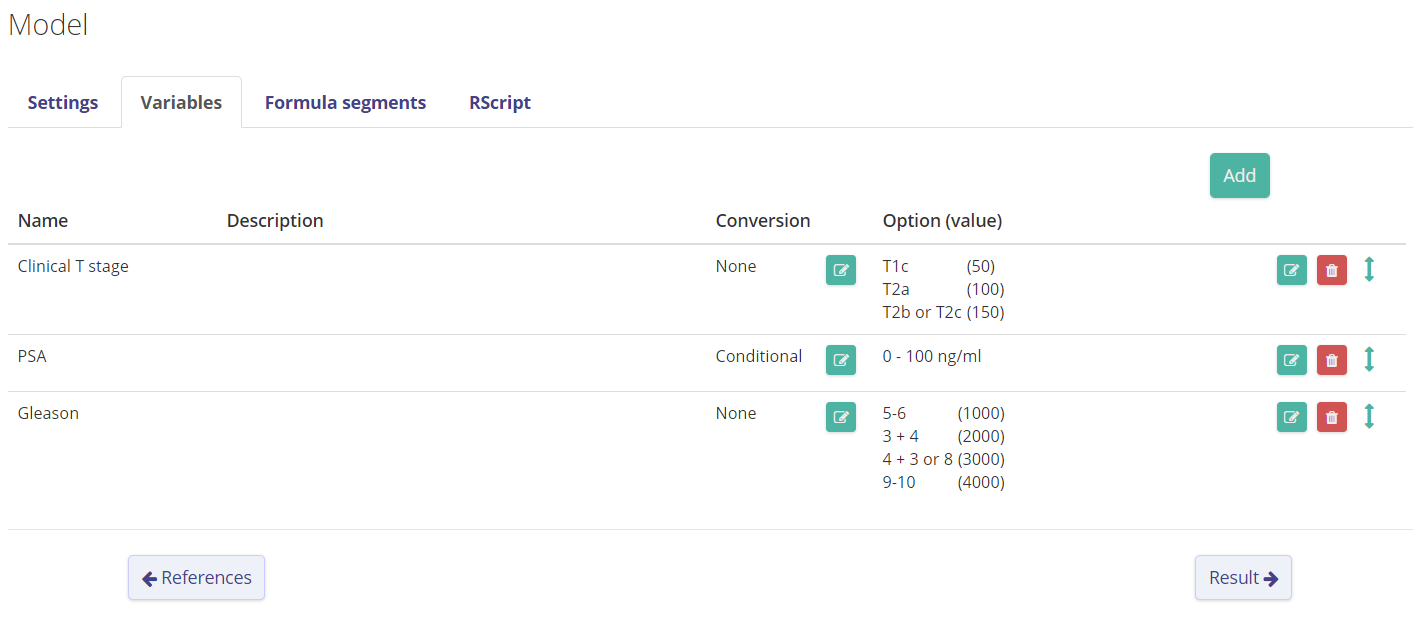
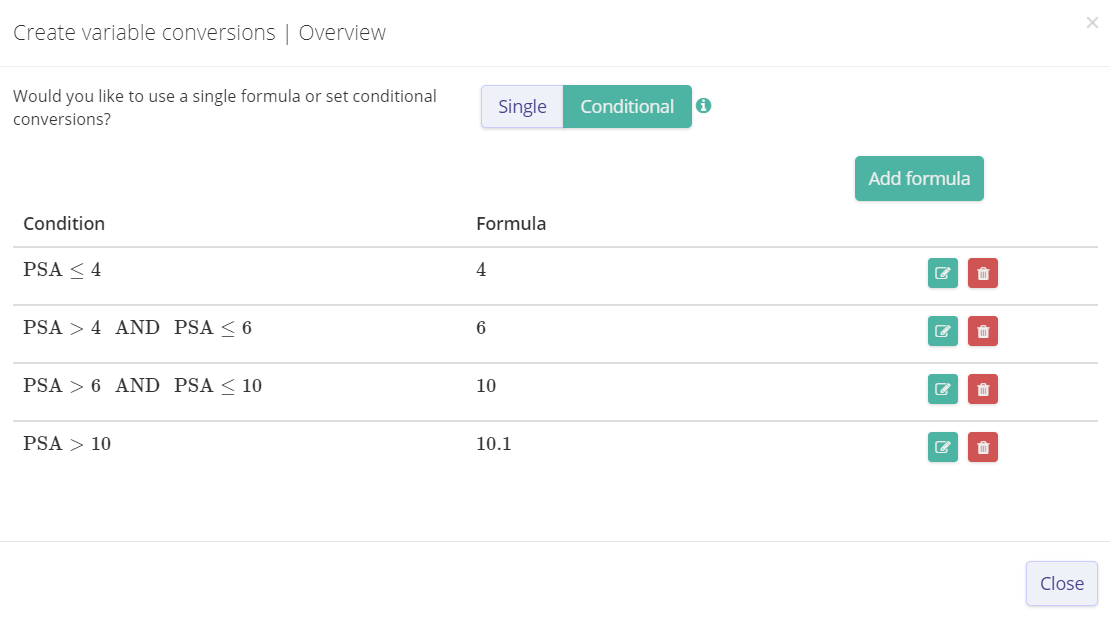
First we add the variables on Evidencio. See this screenshot on how the variables were added. The PSA value was added as a continous variable to simplify entering patient input in the model. Therefore, this formula was converted. See this screenshot to see the conversion.
The last step is to add the Rscript formula in the Rscript tab. The constructed Rscript can be seen below. The Partin table is constructed first, then the location of the cell containing the probability is located based on the input in the model. Make sure to always add return before the part of the script where the single outcome should be returned. In this example, the code in the script matches the input of cT and PSA to return a single row. So using the cT1c and PSA = 15 example, the script should locate the 4th row (Clinical stage = 50, PSA = 10.1). The script then locates the column corresponding with the input gleason score, if the gleason score is 3+4, the 4th column should be selected. The location of our probability is found in the location (4,4), i.e. fourth row and fourth column. This cell contains the prediction 5%. For all the input possibilities, there is only one cell that can be returned.

Don't forget to add pre- and/or post-result tekst to make sure the user knows what he/she is calculating. The calculation of the given example in the eventual model looks like this:
